当前位置:石家庄泛胜科技有限公司>>植物生理仪器>> Chlorophyll Meter (叶绿素仪)


Ⅰ. Introduction
Chlorophyll plays a crucial role in the photosynthesis of plants. Its content is an important indicator of plant nutrition stress, photosynthetic capacity, and growth conditions. Chlorophyll content measurement can be used to monitor the growth and development conditions of plants, thereby making scientific guidance of c*tion, fertilization and management, ensuring the good growth vigor, and enhancing crop quality and yield. As a result, it is of great significance for precision agriculture and forestry.
The chlorophyll meter is able to measure the relative content of chlorophyll in plant leaves (unit SPAD) or “greenness", thereby learning plants’ actual demands on nitryl and helping the user identify the shortage of nitryl in soil or whether nitrogenous fertilizer has been applied excessively. This meter can be used to enhance the utilization ratio of nitrogenous fertilizer and protect the environment.
Traditionally, chlorophyll content is measured using chemical methods, which not only time and energy-consuming and harmful to plants. With the development of spectrum technology, it has been a research focus to make quick noninvasive diagnosis using spectrum technology in precision agriculture. Spectrum technology is one that describes the information contained in spectrum data by means of the relationship between spectrum response and wavelength of the target. Spectrum characteristics of plants present the changes of light absorption, transmission and reflection of plants caused by their physiological features. Therefore, the physiological information of plants can be extracted by means of spectrum monitoring. The principle of spectrum-based crop physiological information detection is that changes of plant leaf color, thickness and morphology are subject to the influence of the changes of plant physiological information, thereby leading to varied spectrum absorption, reflection, and transmission features. For example, the spectrum monitoring of plant nitrogen nutrition is made by detecting different reflecting, absorption, and transmission spectra caused by different absorption and reflection of light of certain wavelengths due to the vibration response of chemical bonds of molecules of various proteins, amino acids, chloroplasts, and other nitrogen forms at a certain radiation level (different frequencies or wavelengths). When it is specific to chlorophyll, the spectrum absorption of chlorophyll is that the absorption peaks lie in the blue and red spectral regions while the absorption valleys lie in green spectral region. There is barely absorption near the red spectral region. When light reaches the leaf, some will be absorbed by chlorophyll, some will be reflected, with a small part penetrating the leaf. The relative chlorophyll content within the leaf can be worked out by measuring the light intensity penetrating the leaf, making A/D conversion, and processing data using the micro-processing unit.
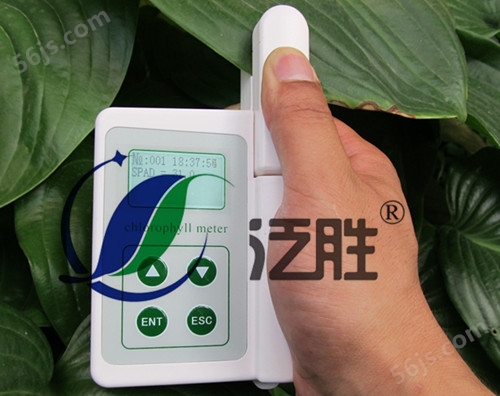
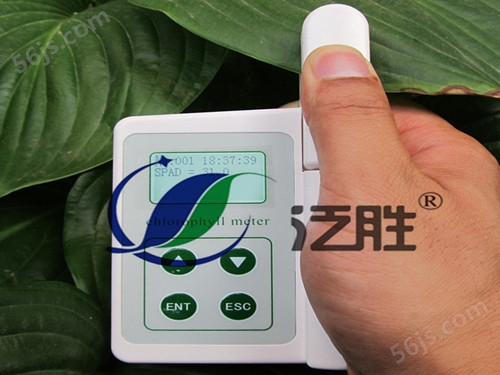
Ⅲ. Measurement Principle and Steps
Ⅳ. Major Technical Indicators
1.Measurement range 0.0-99.9SPAD
2.Measurement area 2mm*2mm
3.Measurement precision within ±1.0 SPAD unit (SPAD is between 0-50)
4.Repeatability within ±0.3 SPAD unit (SPAD is between 0-50)
5.Measurement interval <3s
6.Date storage SD card
7.Data storage capacity 2GB
8.Power 4.2V rechargeable lithium battery
9.Battery capacity 2000mah
请输入账号
请输入密码
请输验证码
扫一扫访问手机商铺
以上信息由企业自行提供,信息内容的真实性、准确性和合法性由相关企业负责,物流技术网对此不承担任何保证责任。
温馨提示:为规避购买风险,建议您在购买产品前务必确认供应商资质及产品质量。


 物流技术网
物流技术网